
Pacific Polycompounds’ rooftop solar was reading 120 kW on a 500 kW rating. Here is what our drone solar plant inspection found
Drone solar plant inspection at Pacific Polycompounds, Ankleshwar. Their 500 kW rooftop was reading 120 kW. What the thermal survey found and what it couldn't.
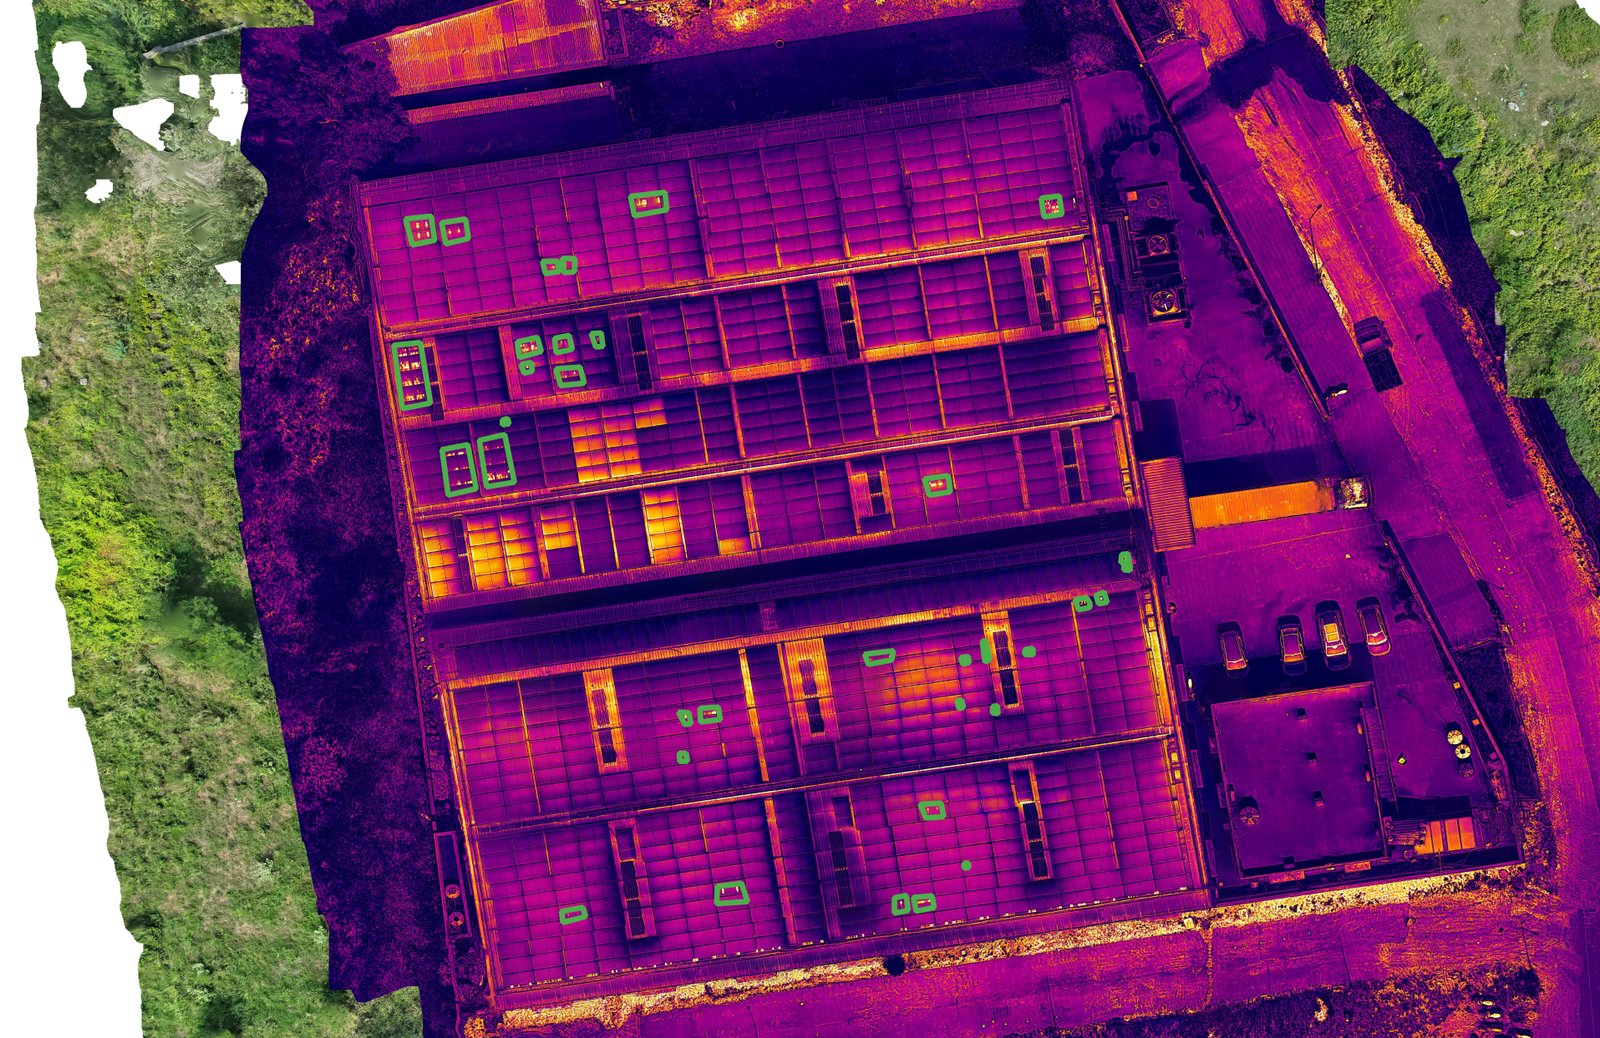
Geocartis case study. Survey flown 18 October 2026, report issued 20 October 2026 (reference PV-181026-R05). Ground verification is still open, and this post will be updated with the results.
In October 2026 we carried out a drone solar plant inspection over the factory roof at Pacific Polycompounds LLP in Ankleshwar. The plant was described to us as 500 kW, and the reading the team was seeing on site was 120 to 130. That gap was the reason for the call.
The short answer is that the thermal survey found seven places on the roof worth checking on foot, and on the evidence so far none of them accounts for a shortfall that large. This post sets out what we flew, what the images show, what they cannot show, and why the next step on this site is a meter and inverter check before anyone draws up a module replacement list.
The site
Pacific Polycompounds manufactures LLDPE rotomoulding powder, the raw material for water tanks, road barriers, dustbins and other rotomoulded products, at its plant in Sudama Industrial Estate, Ankleshwar, in Bharuch district. The solar array covers most of the roof of the main factory building, so this is a commercial and industrial (C&I) rooftop plant, laid out very differently from a ground-mounted solar park.
That difference matters for the inspection. A rooftop array is broken up by walkways, skylight strips, ventilation equipment and, on this roof, a long central corridor. All of those appear in a thermal image, and some of them appear brightly.
What we were asked to find out
The question was simple to state: is something on the roof failing, and is it the reason the plant seems to be producing roughly a quarter of its rating?
Two numbers were passed to us, a plant rating of 500 and an operating figure of 120 to 130. At the time of the survey nobody had confirmed the units, whether 500 is the module (DC) capacity or the inverter (AC) capacity, or which screen or meter the 120 to 130 came from. We recorded both as client-reported figures and kept that label throughout the report.
How we flew the survey
The survey was flown on 18 October 2026 around midday, and the reference frames used for the location map were captured at 12:08. We captured paired visual (RGB) and thermal imagery: RGB frames at 4032 × 3024 pixels and thermal frames at 1280 × 1024 pixels. After screening, 431 distinct stills were usable, 215 RGB and 216 thermal.
Each thermal feature was traced to its approximate position on the RGB view using fixed roof landmarks: the central corridor, the horizontal walkways and the array edges. Every location received a reference ID that stays with it through ground checks, repair and re-inspection, so a finding can be followed from the first image to the final close-out.
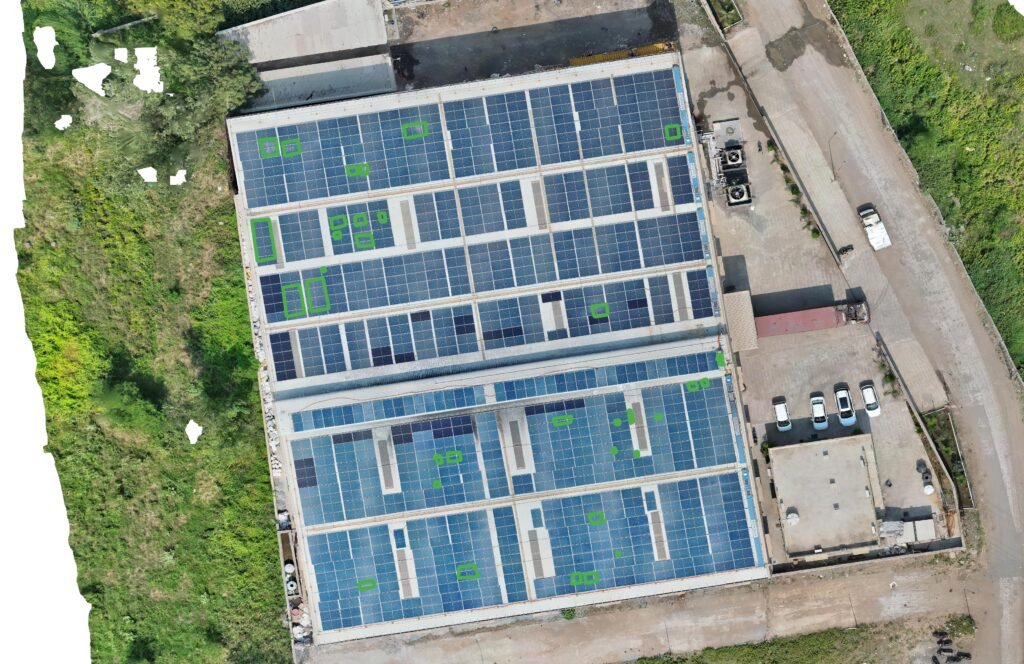
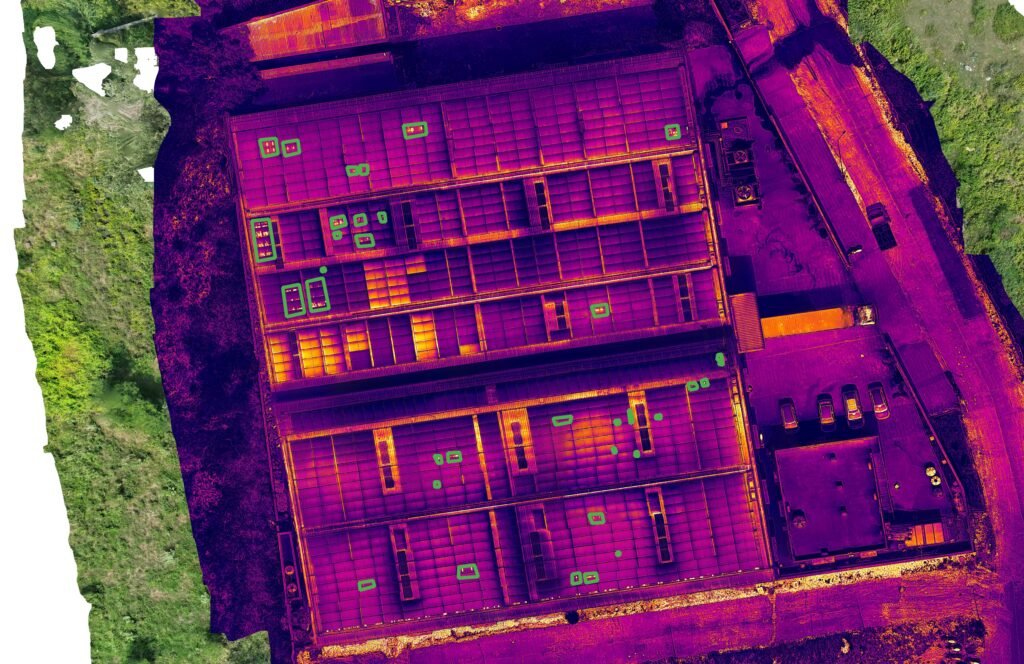
What the thermal images showed
The report identified seven candidate zones. Five are localised bright features, coded P01 to P05. Two are groups of modules that look warmer than their neighbours, coded G01 and G02.
| Zone | What the image shows | Where on the roof |
|---|---|---|
| P01 | Compact bright pair | Leftmost array, lower middle |
| P02 | Cluster of bright points | Leftmost array, bottom section |
| P03 | Bright features beside a walkway and structural members | Second strip, bottom section |
| P04 | Isolated bright feature | Fourth strip, upper middle |
| P05 | Compact bright pair within a generally warmer area | Rightmost array, lower middle |
| G01 | Group of module-shaped areas warmer than the group beside it | Third strip, lower section |
| G02 | Several adjacent warmer module areas | Fourth strip, lower section |
A bright point on a module can mean a cell fault, a failing bypass diode or a hotspot caused by physical damage. It can also mean a bird dropping, a reflection, or a piece of hardware sitting on or near the module. P03 is the clearest example on this roof. Its bright features sit right next to a walkway and steelwork, and until someone stands there and photographs it, there is no way to say whether the heat is in the module or in the metal beside it.
The two group zones raise a different question. A block of modules running warmer than its neighbours can point to a circuit problem, because a module that is not delivering current turns the sunlight it absorbs into heat. Modules that sit next to each other on a roof are not necessarily on the same string, though. Before G01 or G02 can be called a string fault, someone has to trace the wiring and compare that circuit’s readings with a similar circuit at the same moment.
What the drone solar plant inspection could not tell us
An O&M team needs this part of a report as much as the findings, because it decides what they can act on.
There are no temperatures in this report. The thermal analysis on this job was qualitative: we compared how bright each feature looked against its surroundings in the colour palette. Calibrated temperatures and temperature differences (delta-T) were not established, so no zone carries an IEC severity class.
There is no validated conditions record. Irradiance, wind and the plant’s electrical state at the time of capture were not measured and logged. IEC TS 62446-3, the technical specification for infrared thermography of operating PV plants, sets minimum conditions for a classified inspection, including irradiance of at least 600 W/m² in the plane of the modules. Without that record we did not describe this survey as a classified inspection to that specification, and we did not want the client to read it as one.
There is no defect count. Seven zones are seven places to look, and they are not seven failed modules. The cluster at P02 could turn out to be one module, several modules, or something lying on the glass.
There is no loss figure. We did not put a wattage or a rupee value against any zone. With no confirmed fault and no agreed performance baseline, any number would have been made up.
Why we pointed at the meter first
If both figures are in kW and the reading is instantaneous output, 120 to 130 on a 500 kW plant is 24 to 26 per cent of the rating. For seven localised zones to explain a gap that size, they would have to involve a very large share of the array, and the images do not show that.
Several simpler explanations need checking before anyone climbs onto the roof with a replacement module:
- The two numbers may not measure the same thing. The 500 could be DC module capacity while the reading is AC output, grid export after the factory’s own load has taken its share, or a daily energy total in kWh rather than power in kW.
- The reading may have been taken at a time of day, or in weather, when no plant would be near its rating.
- One inverter may be offline or limited. On a plant split across several inverters, losing one shows up as a large block of missing output.
- A string or MPPT input may be down, which would appear in the inverter data before it appears anywhere else.
So the first step our report recommended was a reconciliation: confirm the rating and its units, take synchronised readings from each inverter and the generation meter, and review the alarm history. If one inverter or circuit is short, trace it to the roof. If a traced circuit lines up with G01 or G02, the thermal and electrical evidence support each other, and the diagnosis is far stronger than either would be alone.
What happens next on site
Each zone will end with one of four statuses. Confirmed means the physical asset is identified and field evidence establishes the condition. Reclassified means the feature is real but belongs to something other than what was first suspected, such as a hot bracket rather than a hot cell. Dismissed means the evidence supports a non-defect explanation, such as a reflection, and the photograph and reason stay in the record. Open means the checks are not finished.
The zone IDs stay the same throughout. When the roof is flown again, P01 is still P01, and the next report can show which findings were fixed, which persist and which are new.
Electrical testing, isolation and repair belong to qualified PV service personnel working to the site’s procedures. Geocartis does not carry out electrical work, and our report does not instruct anyone to replace a module on the strength of an image.
If your rooftop plant is reading low
Based on this job, these are the checks worth making before you book any inspection:
- Find out exactly what your low number measures: which screen or meter, which unit, and at what time it was read.
- Pull the inverter-level readings for the same moment and see whether one inverter or input is contributing much less than the others.
- Have your as-built layout and string diagram ready, so any finding can be tied to a real circuit.
- If a cleaning cycle is due, clean first. Soiling produces thermal patterns of its own that can hide module faults.
If the electrical data points to a weak circuit, or you want every module on the roof looked at in one visit, a drone solar plant inspection covers the whole array and gives each finding a location your O&M team can walk to.
Frequently asked questions
Can a drone thermal survey find why a solar plant is underperforming?
It can find where modules or groups of modules behave differently from their neighbours. On its own it does not prove the cause of a plant-level shortfall. That needs inverter and meter data read alongside the images.
Does a bright spot on a thermal image mean the module needs replacing?
No. A bright area is a place to check. On this job every finding was treated as a candidate until a technician had identified the asset and the cause.
Is a rooftop solar inspection different from a solar park inspection?
The method is the same. A roof adds walkways, skylights, ventilation units and steelwork that can look bright in thermal images, so identifying the object on site matters more.
Which standard covers drone thermal inspection of solar plants?
IEC TS 62446-3:2017 covers outdoor infrared thermography of operating PV modules and plant. It sets the measurement conditions, equipment, procedure and reporting requirements for a classified inspection.
We will add the ground verification results and the outcome of the meter reconciliation to this post once the site team has closed the zones. If your own plant has a gap between its rating and its readings, send us the location and capacity and we will tell you what an inspection can and cannot answer for it.
References: IEC TS 62446-3:2017, Photovoltaic systems: requirements for testing, documentation and maintenance, Part 3: outdoor infrared thermography of photovoltaic modules and plants. NREL/TP-7A40-73822, Best Practices for Operation and Maintenance of Photovoltaic and Energy Storage Systems, 3rd edition (2018).
Have a site that needs mapping?
Send us the location, the area and the outputs you need. We will come back with the airspace position, a flight plan and a fixed price.
Talk to our survey team